Monitor and debug UI extensions during local development and after deployment using HubSpot’s built-in logging and monitoring tools.
HubSpot provides tools for monitoring and debugging UI extensions throughout the development lifecycle. During local development, the extension logs panel surfaces errors, warnings, and custom log messages directly in the browser. For deployed extensions, HubSpot’s built-in monitoring page lets you review render logs, hubspot.fetch() requests, and custom log output.
To help you identify and resolve issues before deploying a UI extension, HubSpot provides a logs panel that you can access from locally running UI extensions. The panel will surface errors, warnings, and other debugging information related to your extension code, such as invalid UI component prop values.
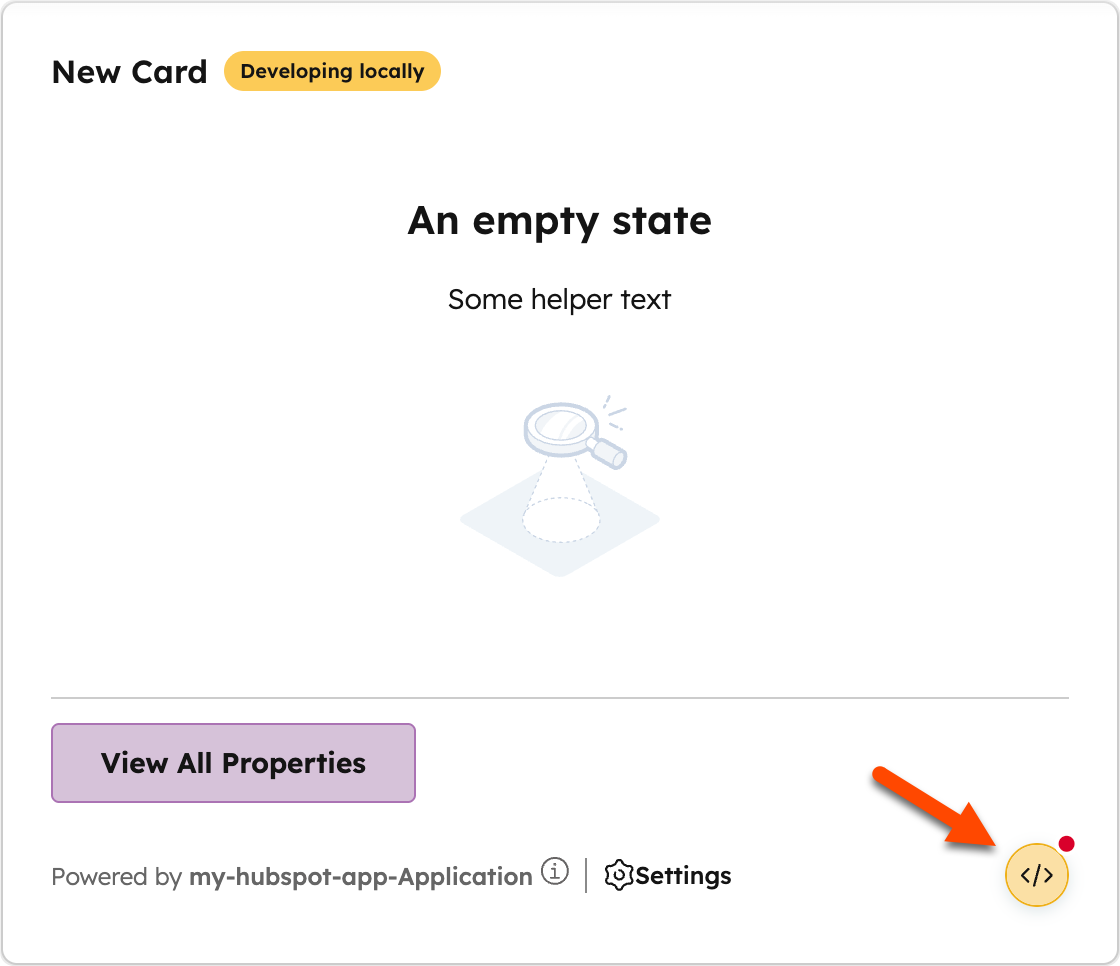
When an error or warning is detected in the locally running UI extension, a button will appear in the bottom right of the extension, which you can click to open the logs panel.
Each log entry includes the severity level and a message describing the issue. When applicable, log entries may include links to relevant documentation to help you resolve the issue. The panel will display up to 50 of the most recent logs collected during your current local development session.
In addition to the logs that are automatically surfaced by the extension logs panel, you can send your own log messages using the logger API provided by the UI extensions SDK.
You can test out custom log messages using the example code below, which creates an extension with buttons to trigger specific errors:
Report incorrect code
Copy
Ask AI
import React from "react";import { Button, Divider, Flex, Text, hubspot, logger, } from "@hubspot/ui-extensions";logger.warn("Warning in the middle tab, before my extension");hubspot.extend(({ context }) => <MiddleTabLogging context={context.location} />);const MiddleTabLogging = ({ context }) => { logger.debug(JSON.stringify(context, null, 2)); const callFetchSuccess = async () => { try { const response = await hubspot.fetch("https://jsonplaceholder.typicode.com/posts/1", { method: "GET" }); const result = await response.json(); logger.info(JSON.stringify(result, null, 2)); } catch (error) { logger.error(error.message); } }; const callFetchFail = async () => { try { const response = await hubspot.fetch("https://jsonplaceholder.typicode.com/posts/404", { method: "GET" }); if (!response.ok) { throw new Error(`HTTP ${response.status}: ${response.statusText}`); } const result = await response.json(); logger.info(JSON.stringify(result, null, 2)); } catch (error) { logger.error(error.message); } }; return ( <Flex direction="column" align="start" gap="small"> <Text>Test out the logger with the following buttons.</Text> <Text variant="microcopy">The browser's developer console will show your events in local dev.</Text> <Divider /> <Text>Test fetch functions</Text> <Flex gap="small" wrap="wrap"> <Button onClick={callFetchSuccess}>Fetch success ✅</Button> <Button onClick={callFetchFail}>Fetch error ❌</Button> </Flex> <Divider /> <Flex direction="column" gap="small"> <Text>Test different log levels.</Text> <Flex gap="small" wrap="wrap"> <Button onClick={() => logger.info("Logging an info!")}>logger.info()</Button> <Button onClick={() => logger.debug("Logging a debug!")}>logger.debug()</Button> <Button onClick={() => logger.warn("Logging a warning!")}>logger.warn()</Button> <Button onClick={() => logger.error("Logging an error!")}>logger.error()</Button> </Flex> </Flex> <Divider /> <Text> Deploy the app and crash the card. Use the Trace ID to see what happened in the Log Traces tab in your private app's dashboard. </Text> <Button variant="destructive" onClick={() => { throw new Error("Card crashed"); }} > Crash the card </Button> </Flex> );};