HubSpot provides tools for monitoring and debugging UI extensions throughout the development lifecycle. During local development, the extension logs panel surfaces errors, warnings, and custom log messages directly in the browser. For deployed extensions, HubSpot’s built-in monitoring page lets you review render logs, hubspot.fetch() requests, and custom log output.
Logging during local development
To help you identify and resolve issues before deploying a UI extension, HubSpot provides a logs panel that you can access from locally running UI extensions. The panel will surface errors, warnings, and other debugging information related to your extension code, such as invalid UI component prop values.
Using the logs panel
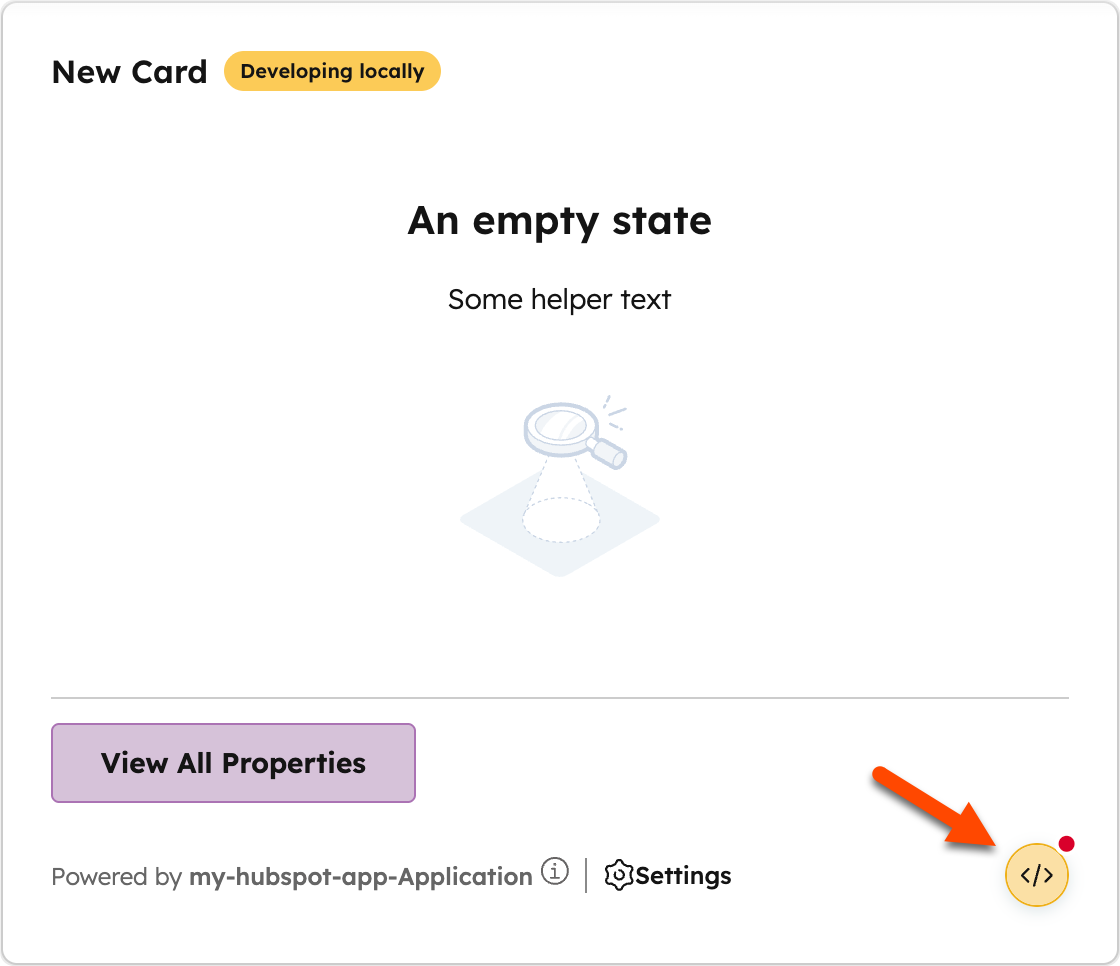
When an error or warning is detected in the locally running UI extension, a button will appear in the bottom right of the extension, which you can click to open the logs panel.
Each log entry includes the severity level and a message describing the issue. When applicable, log entries may include links to relevant documentation to help you resolve the issue. The panel will display up to 50 of the most recent logs collected during your current local development session.
Hiding the logs panel
If you prefer not to see the logs panel during local development, you can hide it by setting the following value in your browser’s localStorage:
To re-enable the logs panel, remove the key or set it to 'false':
Custom log messages
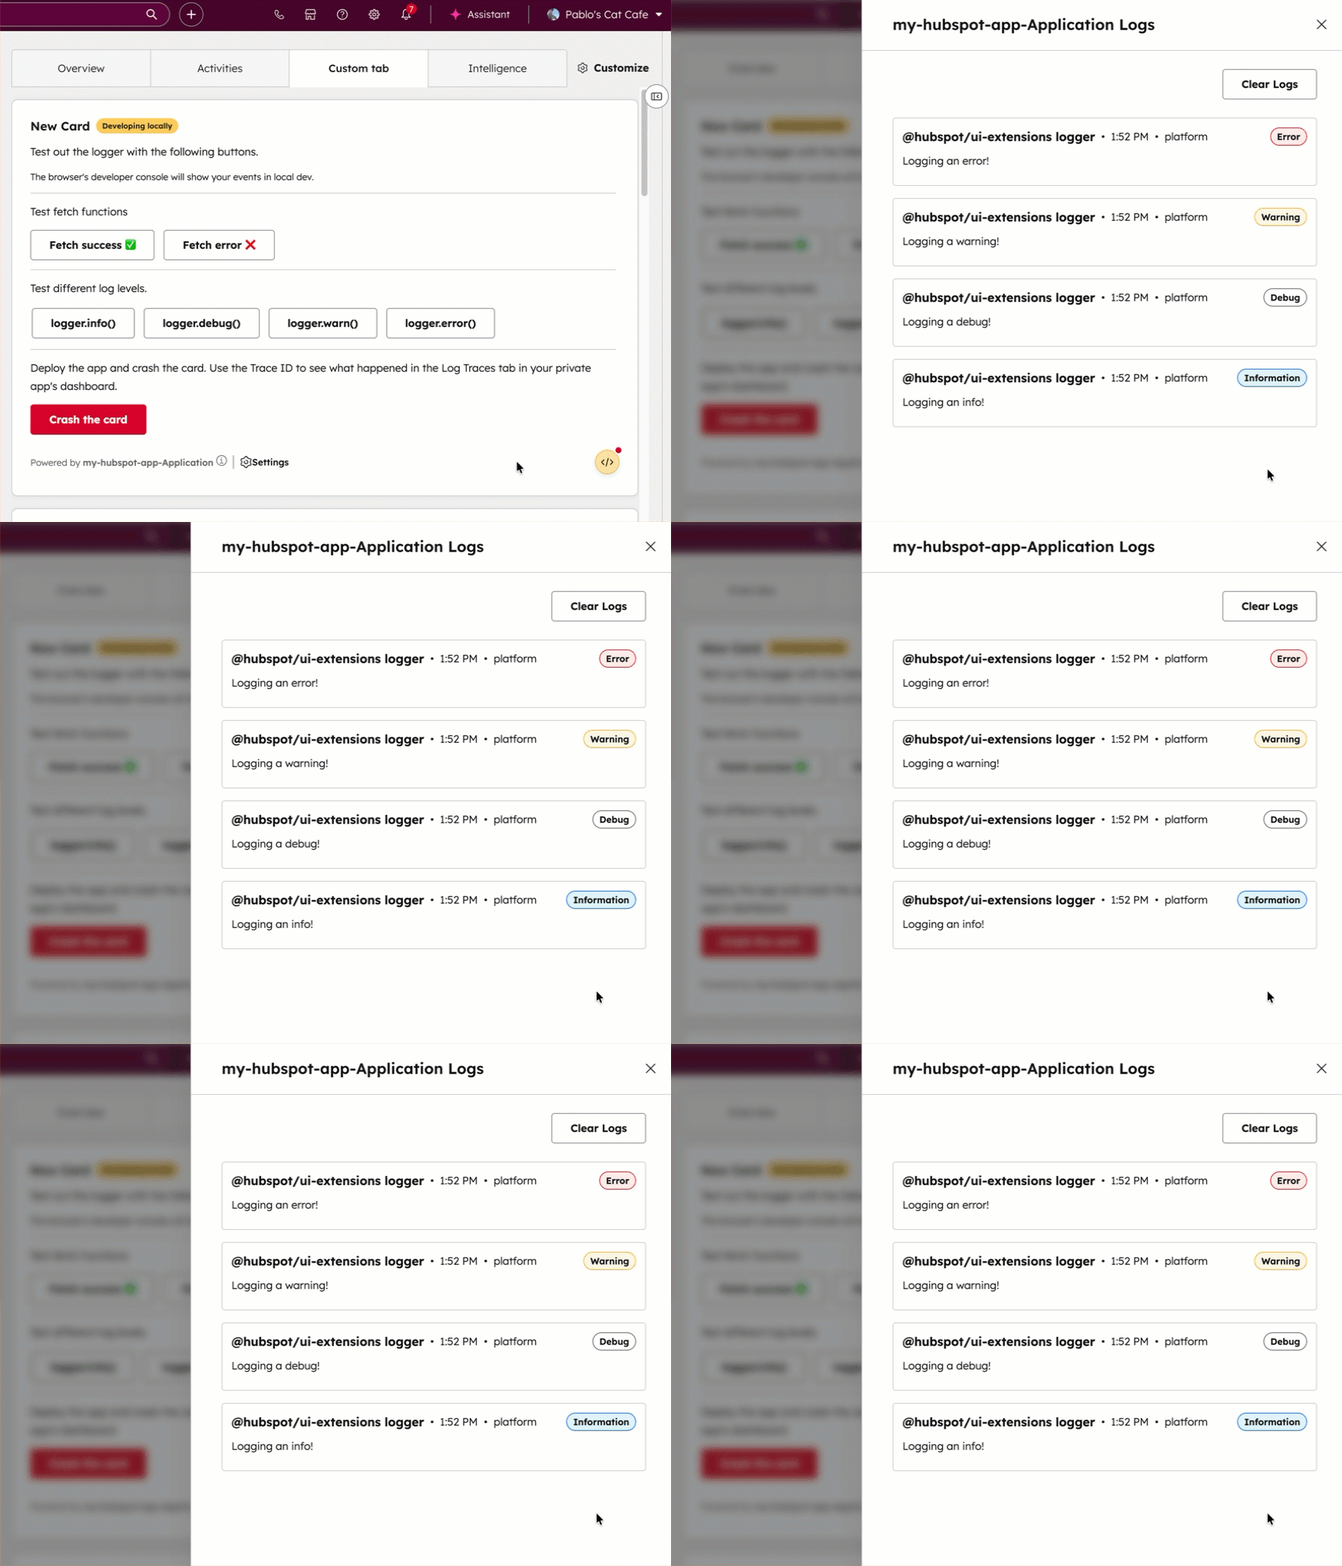
In addition to the logs that are automatically surfaced by the extension logs panel, you can send your own log messages using the logger API provided by the UI extensions SDK.
You can test out custom log messages using the example code below, which creates an extension with buttons to trigger specific errors:
Monitoring deployed extensions
To monitor UI extension activity, you can view request logs in HubSpot:
- In your HubSpot account, navigate to Development.
- In the left sidebar, navigate to Monitoring > Logs.
- On the monitoring page, click the UI Extensions tab.
On the UI Extensions tab, use the various tabs to view the different log types:
- Extension Render: logs related to UI extensions loading in their configured locations.
- hubspot.fetch(): logs related to
hubspot.fetch() requests.
- Extension Log: custom messages logged via the logger API.
To view more information about a log entry, click the ellipsis button in the Actions column of the row, then select an action:
- Open details: review the details for the entry and use the provided IDs for deeper debugging.
- Open tracing: view the complete tracing details for the log entry.
Last modified on May 20, 2026